
Employers hired 1,300 more interior designers between May 2013 and May 2014, bringing the total number of employed designers to 45,010, according to the U.S. Bureau of Labor Statistics. While far from peak employment — which reached 53,290 in 2008 — the number of employed designers is the highest since 2010.
Overall, employment grew by 3 percent during the period covered, notably slower than the 7.3 percent growth achieved during the previous 12-month period. (These figures do not include self-employed designers.)
Firms offering specialized interior design services, which make up the largest sector of employers of interior designers, added 420 jobs (2.4 percent growth), while architecture and engineering firms employed 70 fewer designers (8 percent decline). The biggest growth in interior designer employment was in furniture stores, which added 500 jobs (12 percent growth). Employment in residential building construction increased by 260 jobs, the highest rate of growth (13.6 percent).
States with the highest level of employment for interior designers include California (5,860), Texas (4,070), Florida (3,900), New York (3,380) and Illinois (2,030). Florida, which added 530 jobs, moved ahead of New York, which had 150 fewer employed designers than in the previous 12-month period. Illinois gained 360 designers, to move ahead of Georgia, which lost 240 designers.
A number of states reached their highest levels of interior design employment in the past five years: Arizona, Colorado, Florida, Illinois, Mississippi, Missouri, New Hampshire, New Jersey, North Carolina, Ohio, Oregon, Pennsylvania, Tennessee, Texas, Washington, and West Virginia. The geographical diversity of these states points to a general recovery in the industry nationwide.
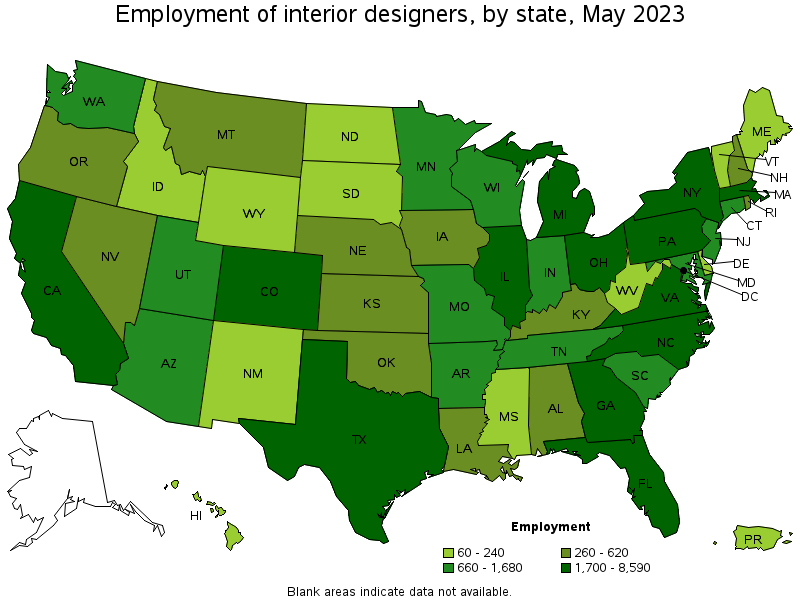
U.S. Bureau of Labor Statistics
Among those states that experienced the highest percentage of growth, both West Virginia and Mississippi doubled the number of employed designers; Rhode Island increased by nearly half (44 percent); and Arkansas, New Hampshire, New Jersey, Oregon, Pennsylvania and Washington grew by about one-third each. Puerto Rico, New Mexico, Nebraska, Wisconsin, Delaware and Maryland experienced the greatest percentage decline in interior design employment, between one-third and one-fifth each.
Interior designers as a group earned slightly more in the period between May 2013 and May 2014. The mean annual wage increased from $54,200 to $54,850 (1.2 percent growth), while the median wage remained about the same, at $48,400. Designers in the lowest percentile earned a mean annual wage of $27,120, while those in the top percentile earned $89,700.
Within the building industry, A&E firms paid the most, a mean annual wage of $59,940 — compared to $55,340 for residential building construction firms and $54,620 for interior design firms. The top paying industry was the executive branch of the federal government, which paid a mean annual wage of $75,730. However, it employed only 320 interior designers.
The top paying states, per mean annual wage, were the District of Columbia ($79,710), Massachusetts ($67,550), Utah ($64,880), Connecticut ($64,090), and New York ($63,630). The top paying metro areas were Santa Barbara, Calif. ($80,490), San Francisco ($73,340), Washington, D.C. ($71,750), with Los Angeles ($68,930), San Jose ($68,840) and Boston ($68,200) following close behind.
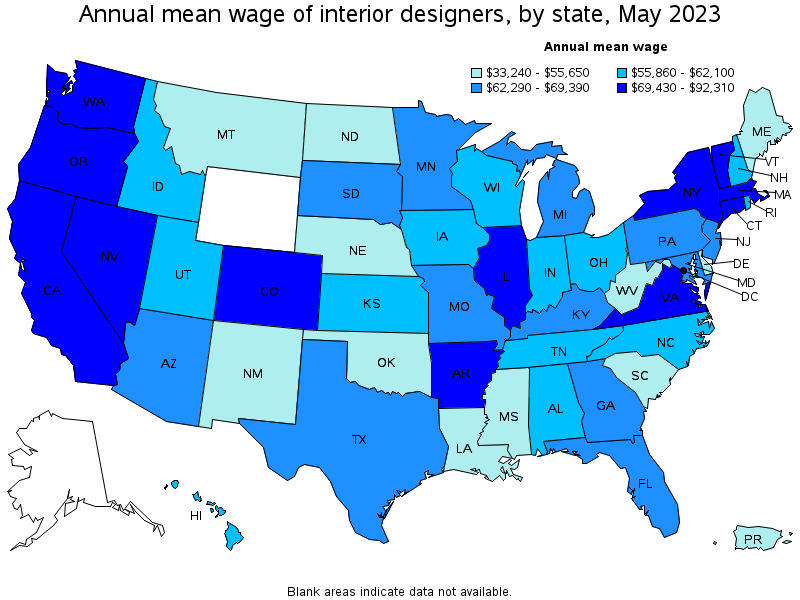
U.S. Bureau of Labor Statistics
Although employment and wages for interior designers continue to be weak in some parts of the country, overall the industry is showing signs of a continuing, if gradual, recovery. As with the previous years' figures, many interior designers still have to go outside of the A&D sector to find employment. Hopefully, that trend will begin to reverse itself as the economy gains a stronger foothold and business increases.
